
DISCLAIMER: I originally posted this article on Microblink.
A couple of months back, we took a look at C++ sanitizers — handy little tools that help us keep our code clean and free of memory bugs.
Today, we’ll take a step back into the past and talk about an older yet still very powerful tool called Valgrind. It has been serving developers for quite some time now as it detects a wide range of errors such as uninitialized memory reads, heap buffer overruns, memory leaks, deadlocks, etc.
After Clang released its collection of sanitizers, Valgrind got pushed into the background, but as you’ll see in this blog post, there are some cases where Valgrind actually knocks sanitizers into a cocked hat.
A beast under the hood
One of the biggest advantages Valgrind has over sanitizers is the fact it doesn’t require software to be instrumented prior to checking it. This means it can be used for debugging any kind of software “right out of the box” without having access to its source code.
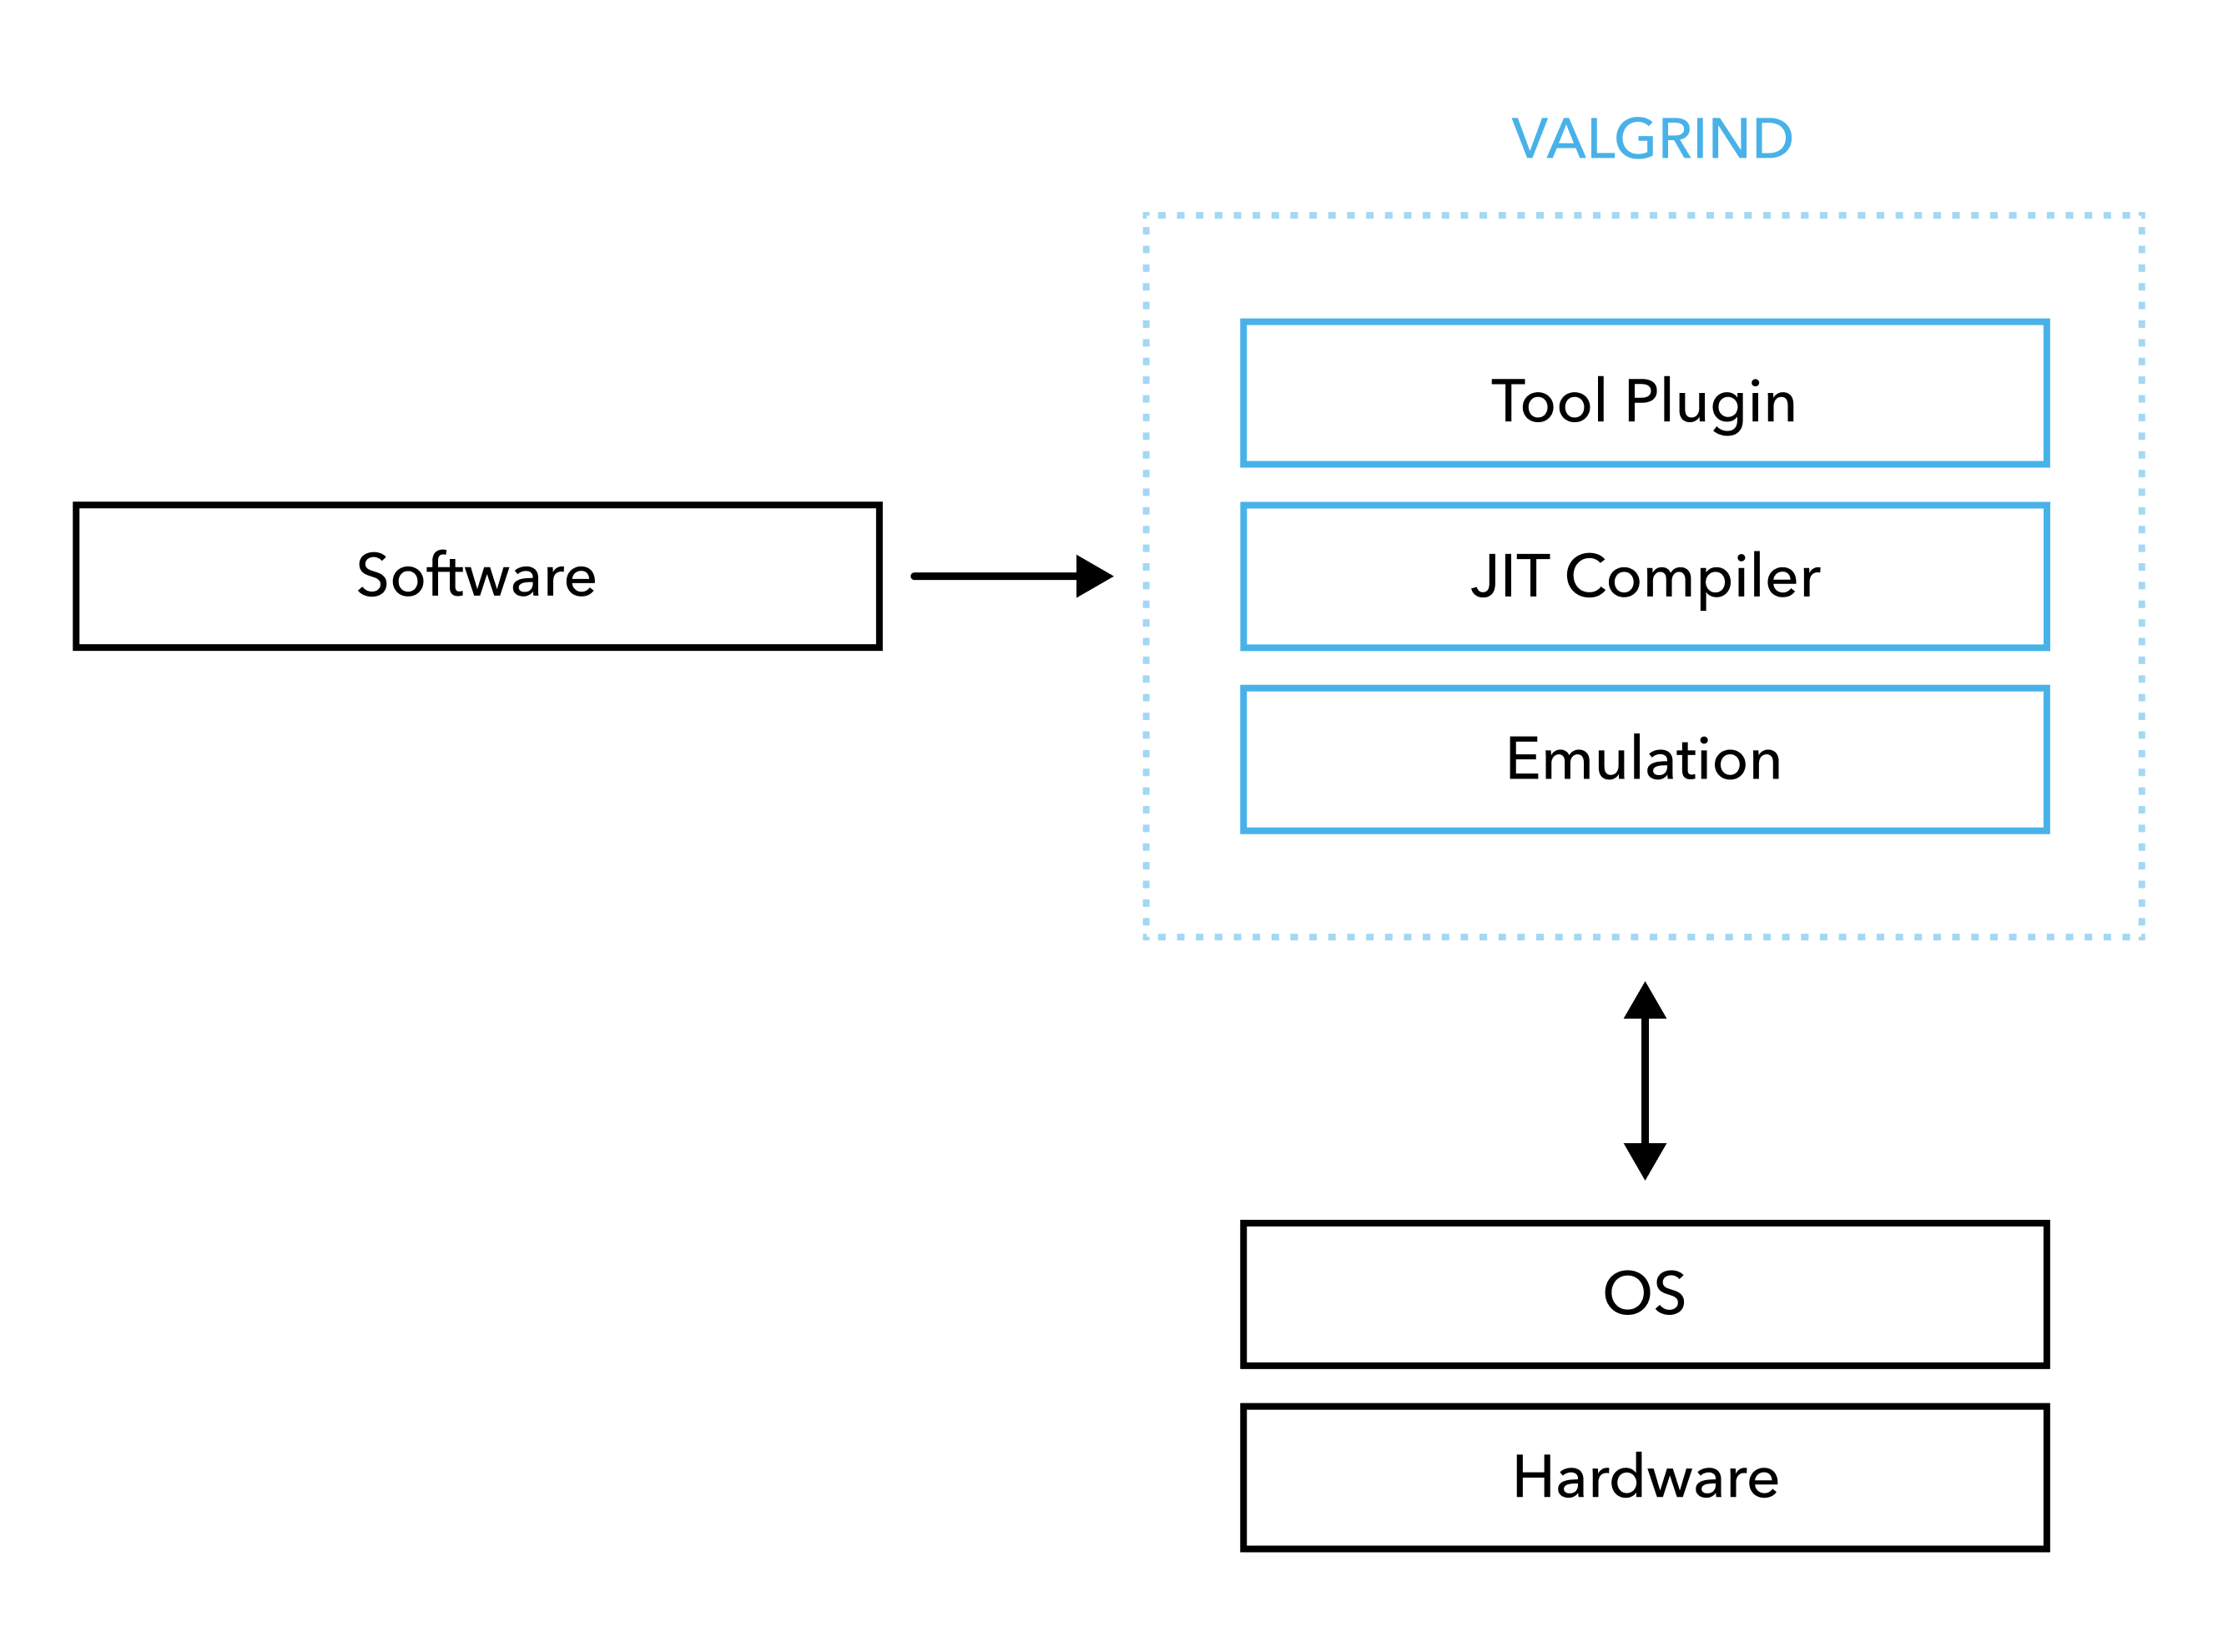
This wouldn’t be possible without the beast under Valgrind’s hood. In short, once Valgrind is initialized, it takes control of your program and runs it on a simulated CPU provided by the Valgrind core. It then adds its own instrumentation code depending on what kind of errors you’re looking to detect.
Unlike sanitizers, Valgrind uses Dynamic Binary Instrumentation (DPI) and Just-In-Time (JIT) compilation to embed our software’s code with the instrumentation code, i.e. to intercept allocation function calls in order to store some additional information.
Here’s how it works. Each allocated block maps to a shadow block where the call stack at the time of the malloc function call is stored. Once the free function is called, Valgrind tries to find the shadow block corresponding to the address passed to free. If the block is not found, Valgrind emits an error message. Otherwise, the block is added to the queue and gets marked as inaccessible. This way, it is possible to detect invalid access to freed memory. However, please note that blocks can be removed from the queue once the system runs out of free space.
Flexibility provided by a layered architecture
As shown in the figure below, Valgrind is made up of two layers: Valgrind core and the tool plugin which can be any of the tools in the Valgrind tool suite, including:
- Memcheck - tracks memory allocations and reports memory leaks
- Helgrind - detects issues related to multi-threading (e.g. deadlocks, data races, etc.)
- Cachegrind - acts as cache and branch-prediction profiler
- Massif - analyses the heap memory usage
Keep in mind that Valgrind is open sourced and you can write your own tool if you want.
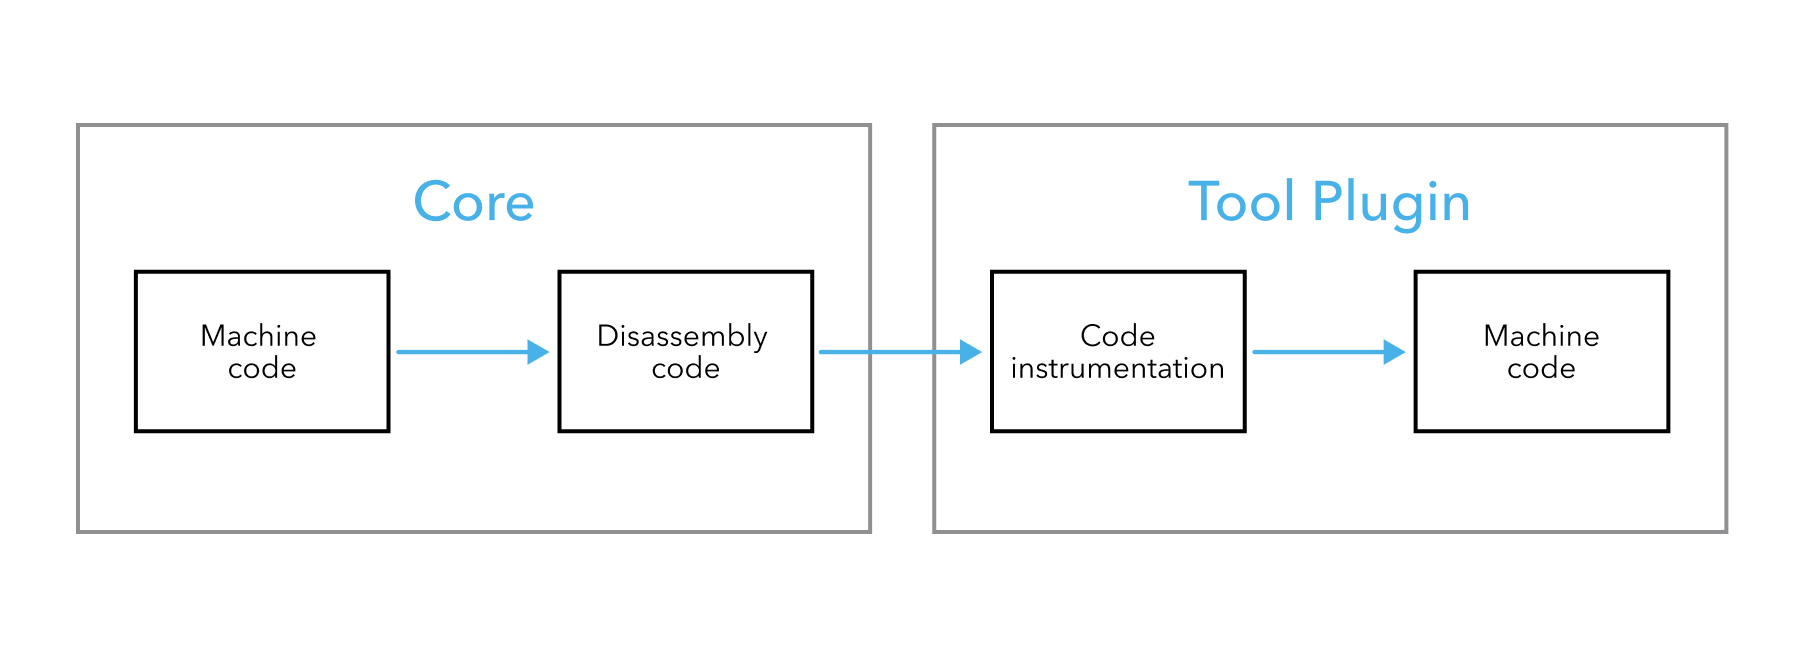
These two layers each have their own role. The core part loads the software under the test into the process and disassembles its code. Once this is done, code fragments are passed to the tool plugin which adds the instrumentation to the code and, finally, assembles it back.
An easier way to debug
As mentioned in our previous blog post, C++ sanitizers require your code to be recompiled. This can be inconvenient when you want to test your code with both AddressSanitizer and MemorySanitizer. Since the two can’t work together, you’d need to perform multiple test runs to detect uninitialized memory reads and other address-related bugs. On the other hand, Valgrind can run pretty much any software as is. The only thing it needs is support for all the instructions our software is using.
Say you wanted to debug a library whose source code is inaccessible. Using sanitizers would yield no results because, unlike Valgrind, they work at the compiler level. With Valgrind, you can handle these cases by default, but keep in mind you may end up with error messages that mean very little to you because you have no control over that code. You are, however, free to filter these messages out by writing them in a suppressions file which is read when Valgrind starts up.
Besides a more streamlined debugging process, Valgrind makes a great substitute on platforms where sanitizers aren’t supported. Apple Clang, for example, doesn’t ship with LeakSanitizer, which makes Valgrind your best alternative unless you’re willing to switch to another compiler.
Performance as the biggest drawback
Let’s take a look at a slightly modified version of the example from our first post about C++ sanitizers:
1
2
3
4
5
6
7
8
9
char const * src{ "Hello world!" };
auto const   dst{ std::make_unique< char[] >( std::strlen( src ) ) };

for ( auto i{ 0ul }; i < 1000000; ++i )
{
    std::strcpy( dst.get(), src );
}

std::puts( dst.get() );
A for loop has been added to emphasize the performance difference between AddressSanitizer and Valgrind. In both cases, the code is compiled using the following command (running ASan also requires us to add -fsanitize=address):
1
clang++ example.cpp -g -o example.out
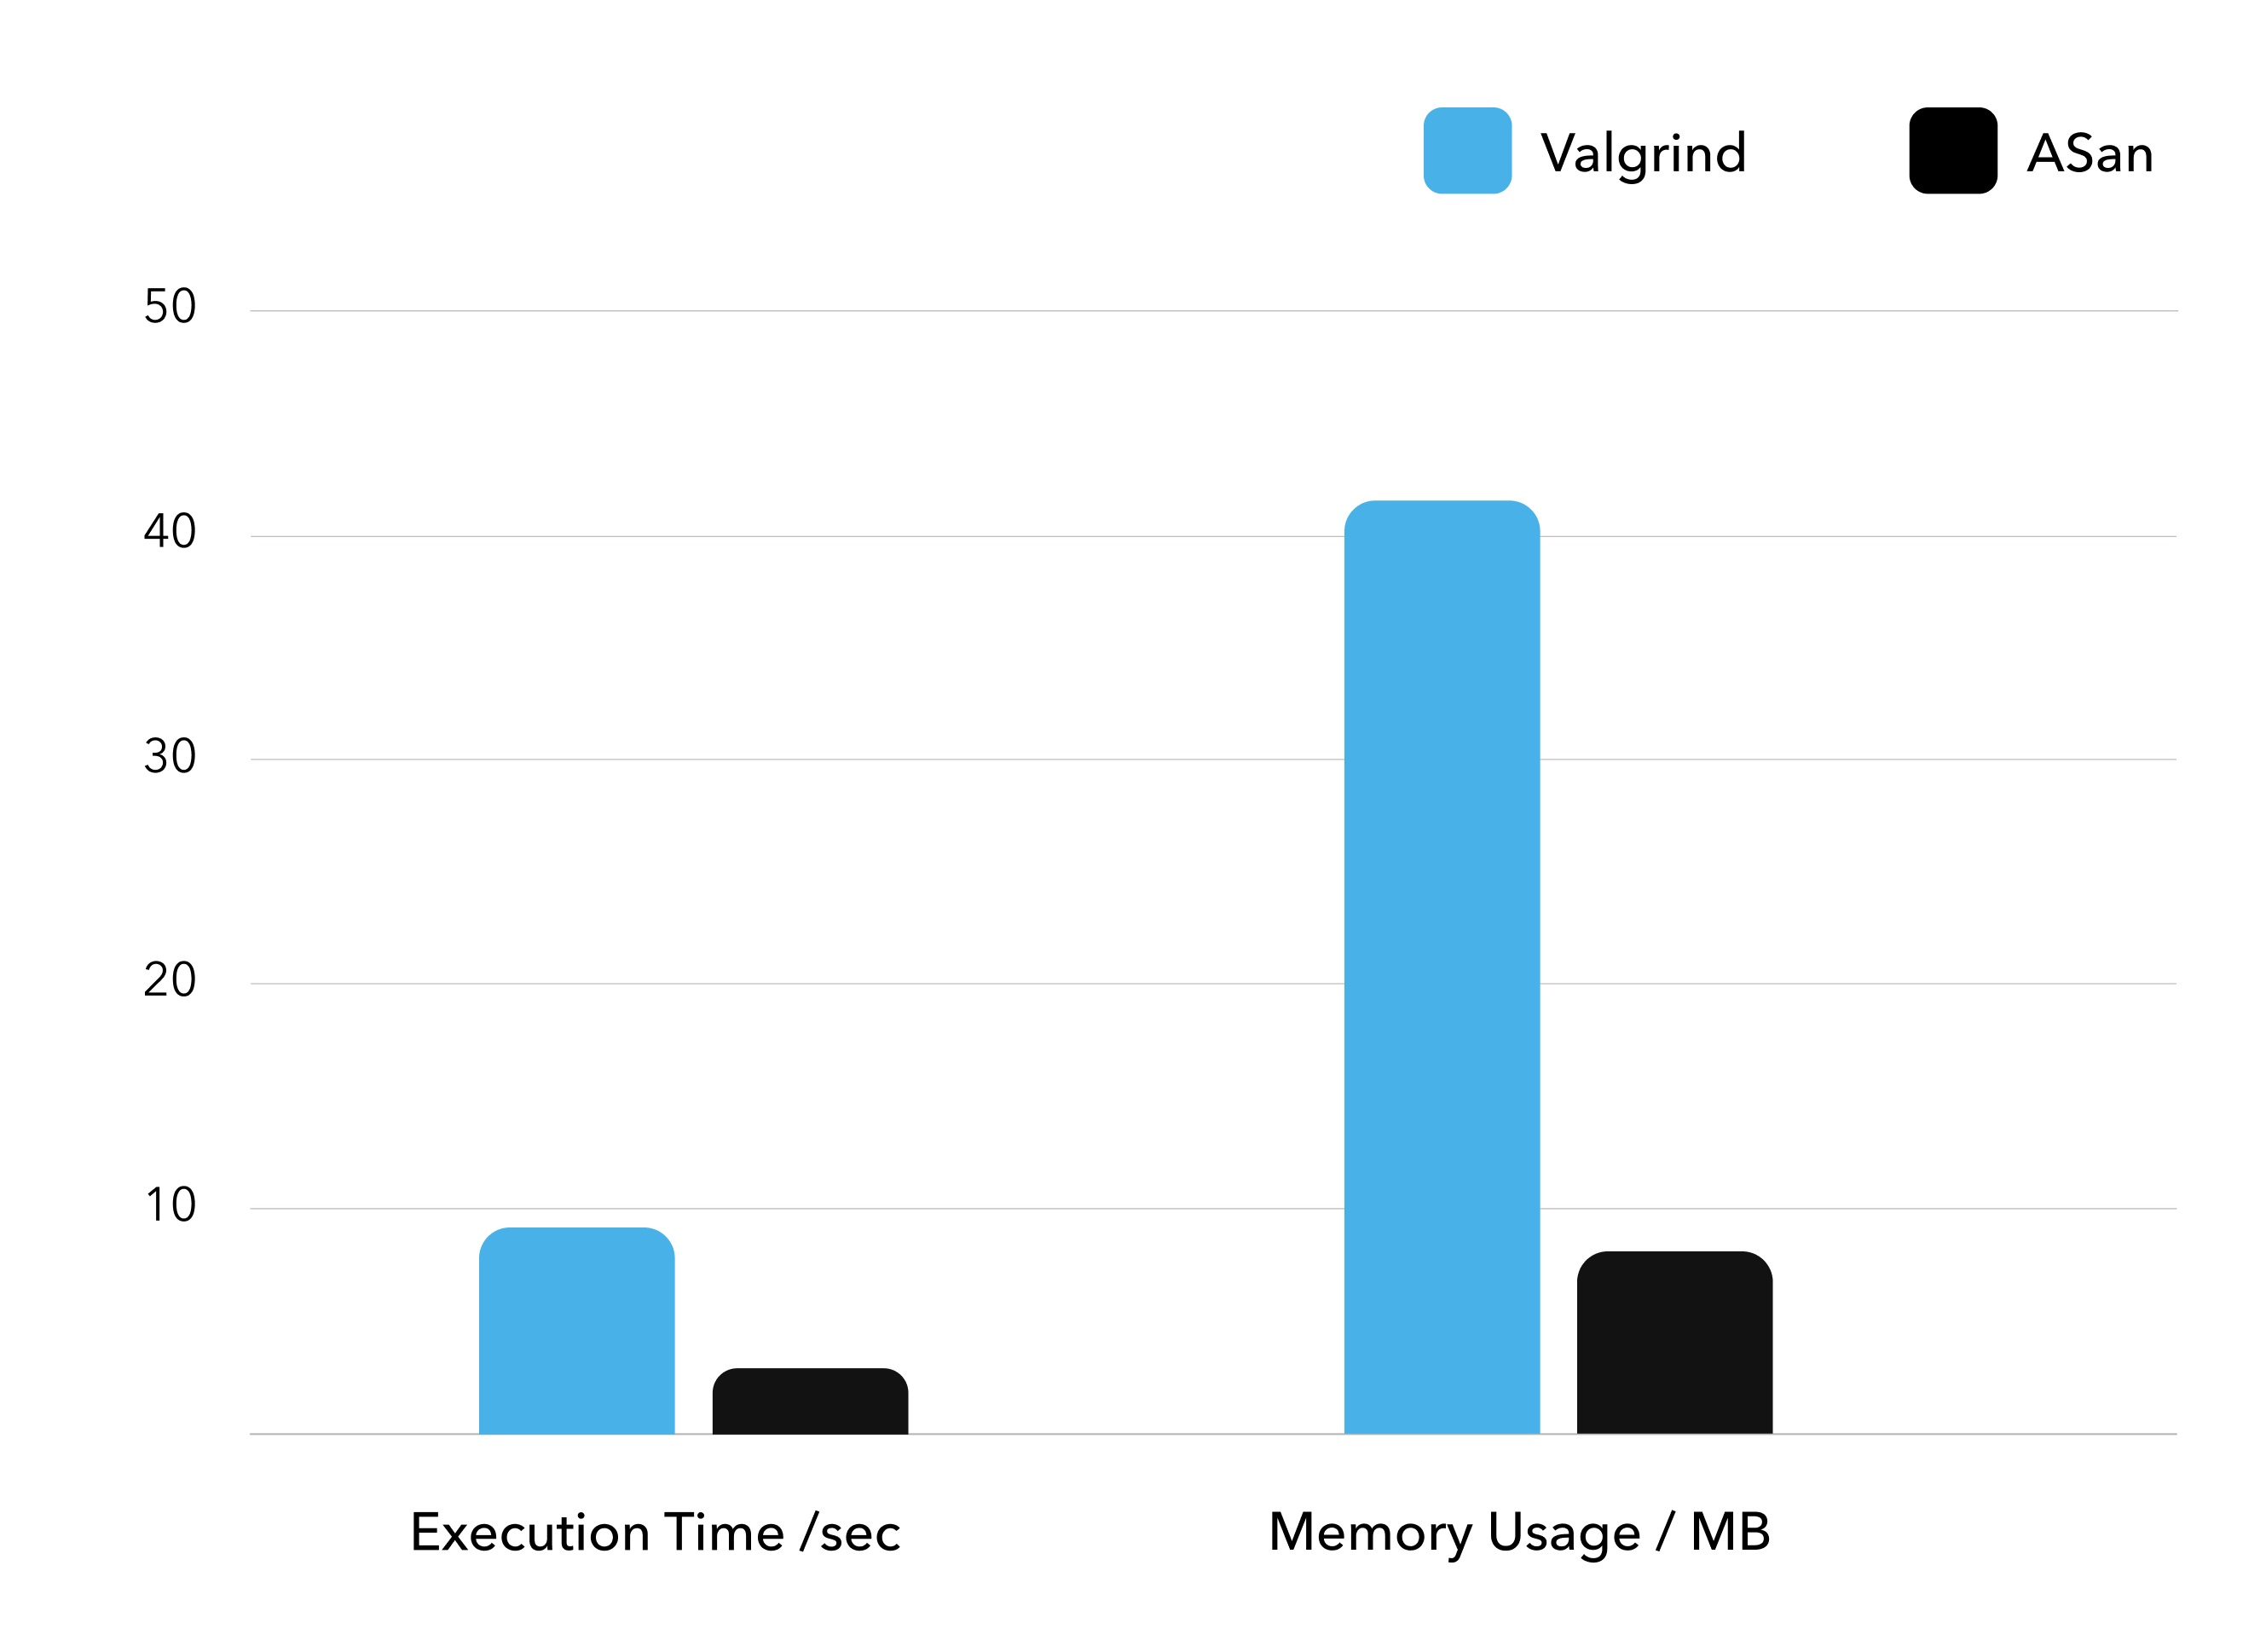
A quick glance at the chart below reveals a huge performance gap between Valgrind and ASan, and this is why a lot of developers may be reluctant to use the tool in the first place.
Side by side comparison
In order to gain a better understanding of what bugs Valgrind and sanitizers are able to detect, let’s take a look at the following table:
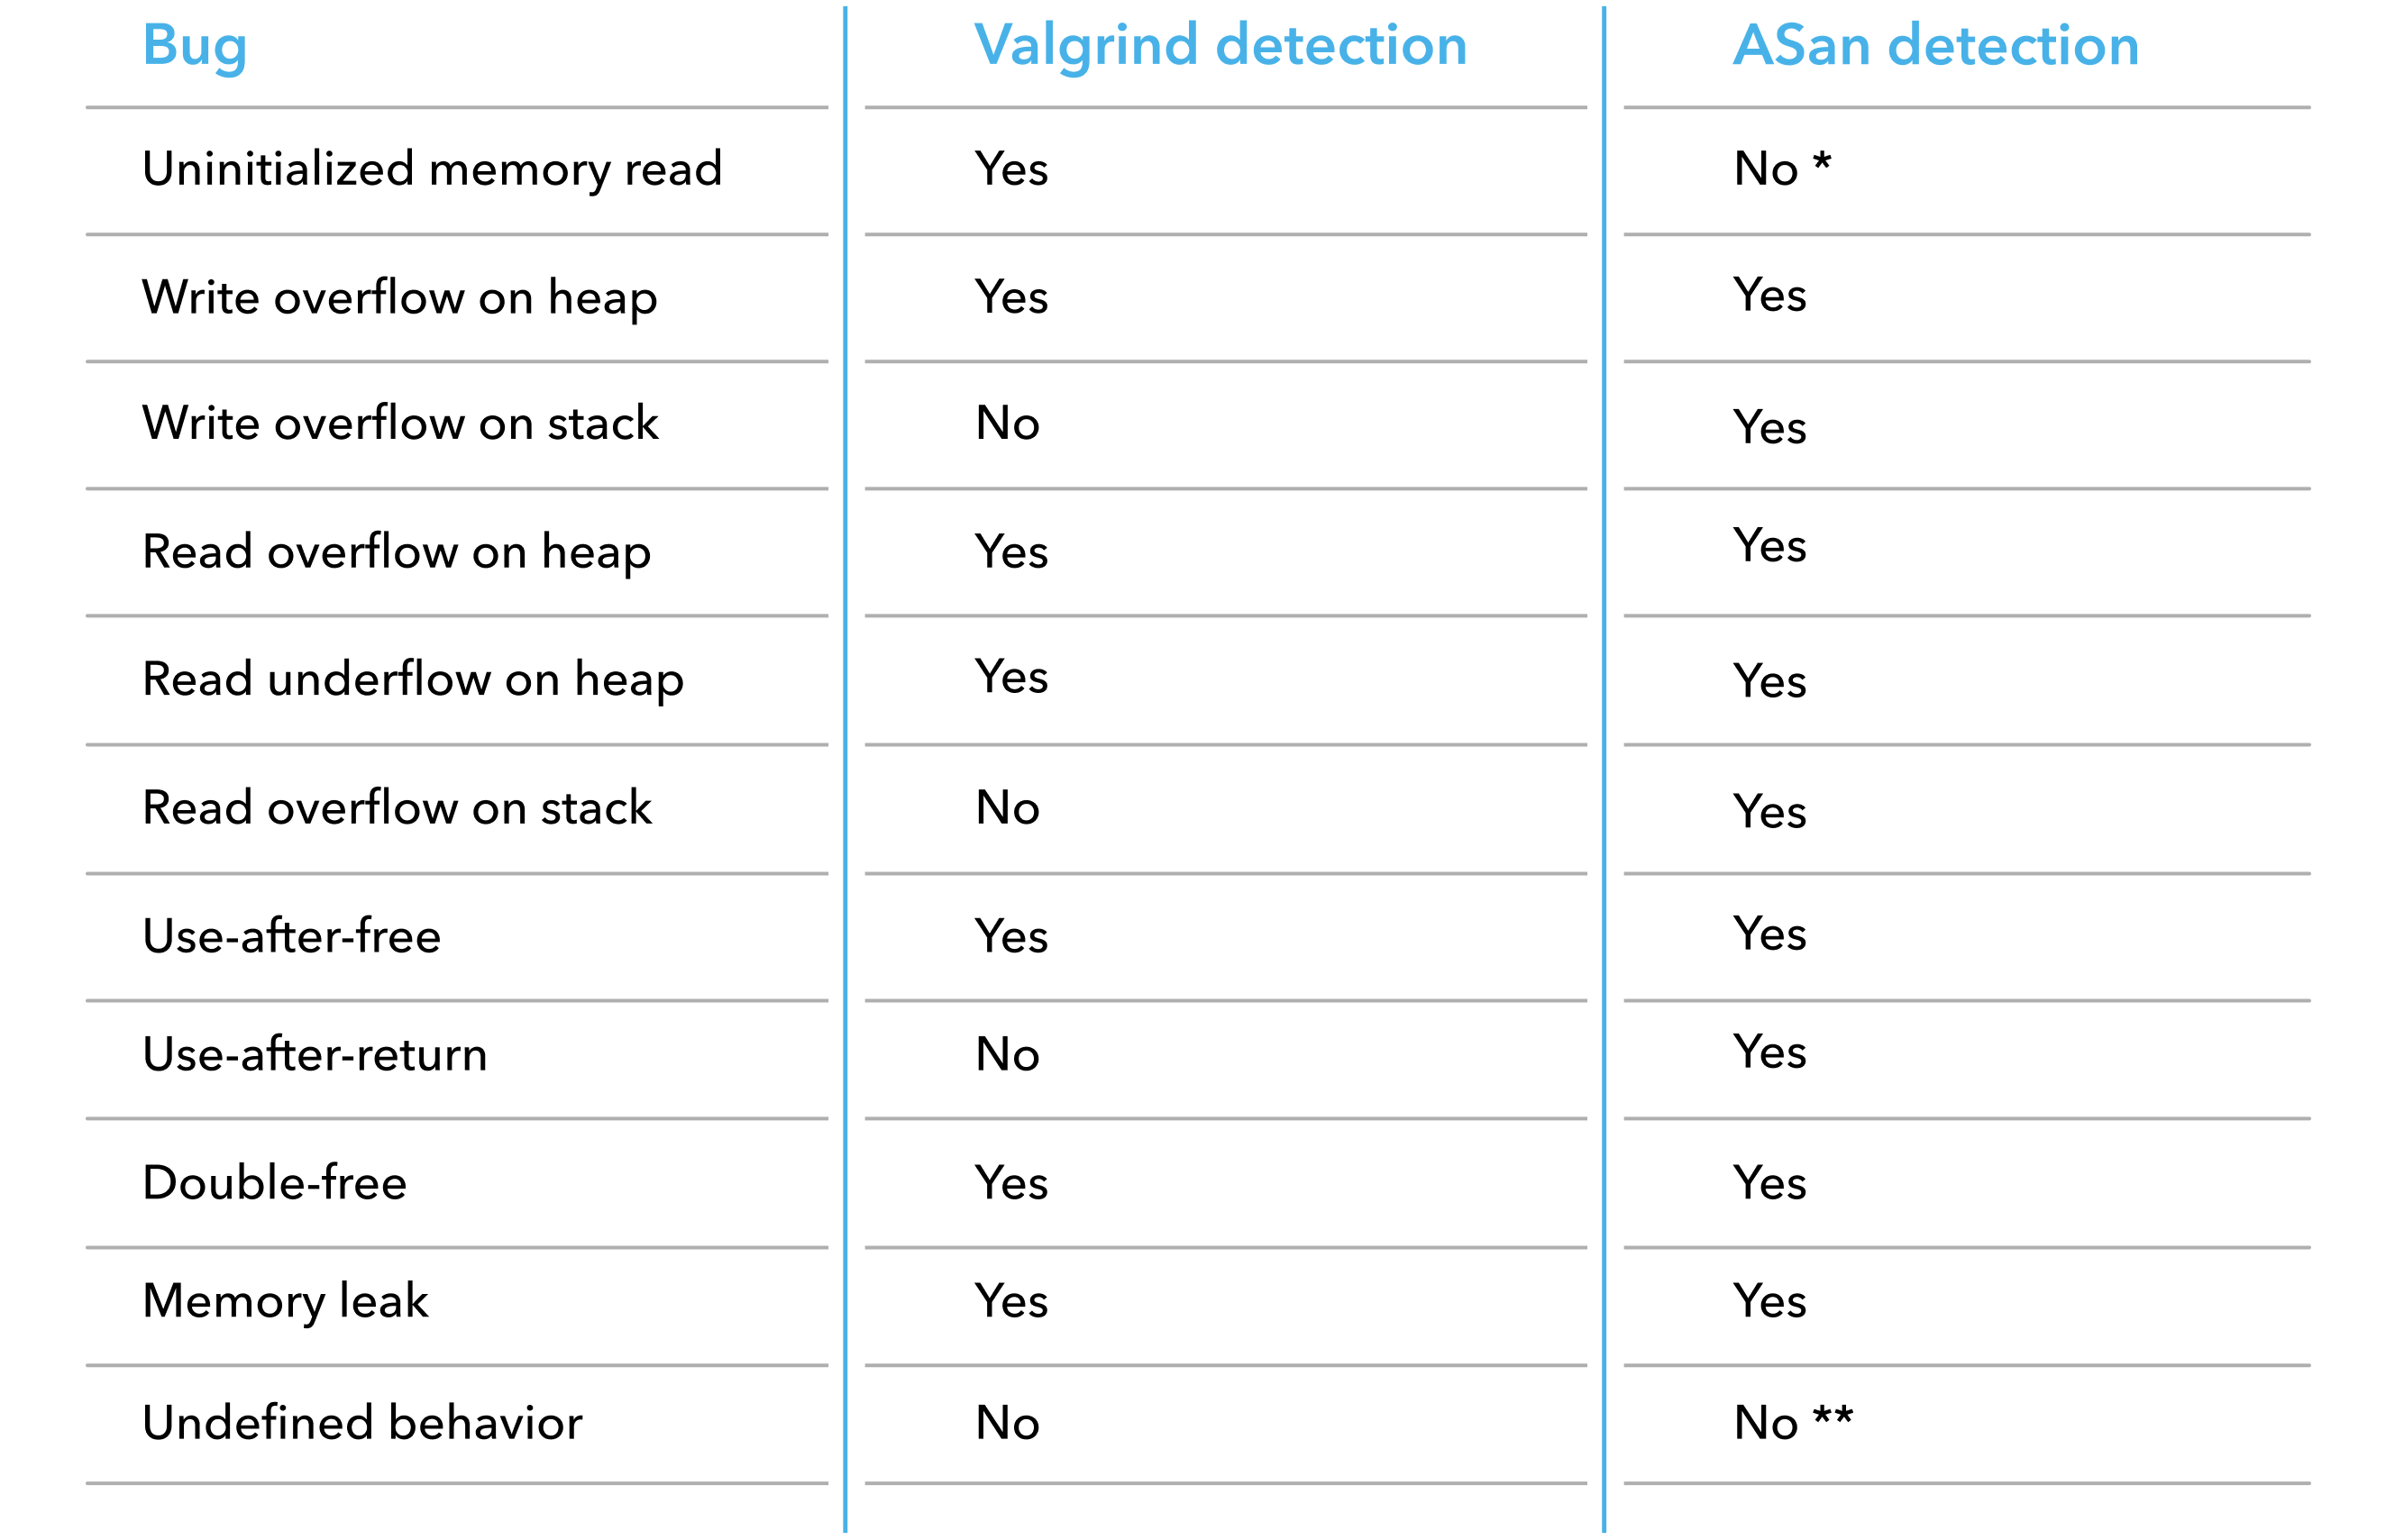
* MSan detects uninitialized memory reads
** UBSan detects undefined behavior
As you can see, Valgrind won’t help you catch overflows in stack and global variables. This is because it only has access to the heap allocations performed by malloc function. Also, don’t count on it detecting any undefined behavior in your code — though you’ll get warned about trying to access memory that resulted from undefined behavior.
At the same time, ASan is not that perfect either. It doesn’t detect uninitialized memory reads nor undefined behavior but MSan and UBSan do.
Valgrind or sanitizers: what should we use?
The question remains then: should we use Valgrind or are sanitizers a better replacement? There is no correct answer to this question as these two tools work in very different ways. Ideally, you should use both depending on your environment and the errors you want to detect.
Even though sanitizers today impose a much smaller CPU overhead and offer a wider range of detected errors, they still have their disadvantages. They work at the compiler level which means you need the source code. They also require you to recompile your code with every test run, take more time to integrate and lack support on certain platforms.
If you have a large project on hand and don’t want to worry about recompiling your code, going with Valgrind might make more sense. We found it especially useful in debugging closed source libraries and detecting things like use-after-free bugs with more ease. Though as sanitizers keep getting better and better, we tend to favor them over Valgrind.
In the end, no matter what tools you use, the most important thing is to make your code as safe as possible. With this in mind, stay tuned for more interesting posts about debugging in C++.